[note: analysis code for this post can be found here and here]
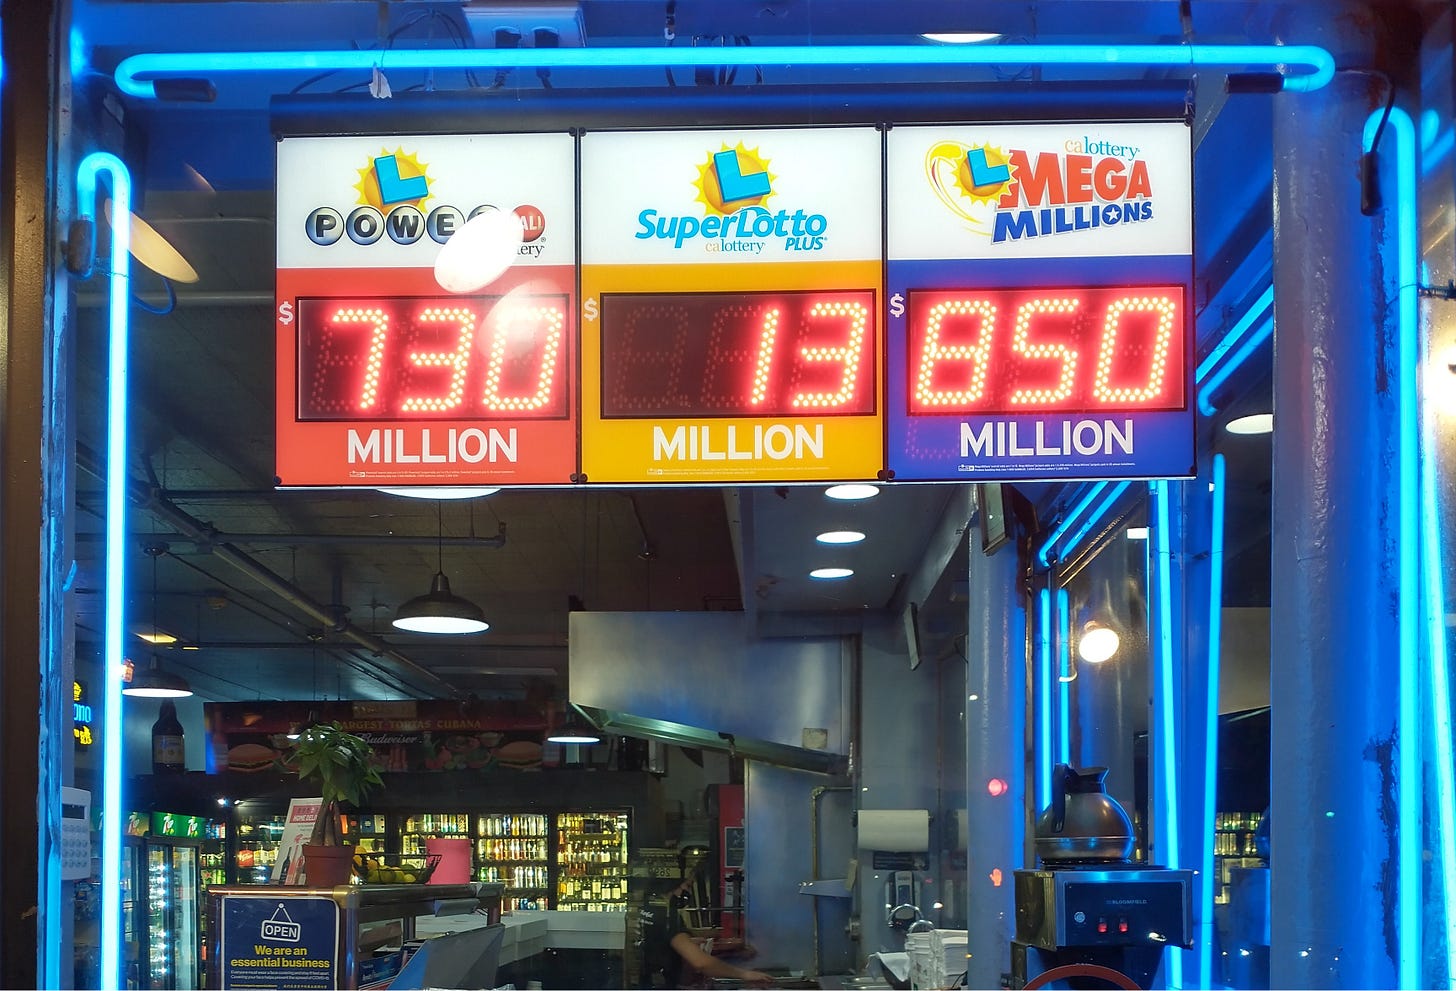
On January 17, 2021, the Mega Millions jackpot was 850 million dollars. Some people roll their eyes and say the lottery is a tax on people who are bad at math. Well, consider me taxed. I bought a ticket.
It’s common knowledge that playing the lottery is a losing proposition. But have you ever actually done the math? How do you really know?
I’ll go through the calculations in a bit. But first, let’s see how much people think their tickets are worth.
How highly do people value their tickets?
In one sense, Mega Millions tickets are worth $2.00. That’s how much they’re sold for and millions of people are willing to pay that much for them. But maybe that price is artificially low. Maybe many people would be willing to pay even more for them. One way to get at this is to look at the other side of the coin. Imagine you just bought a lottery ticket. How much would I have to pay you to set it on fire? Or just to sell it to me?
To get a sense for that, I went down to the Mission District near where I live in San Francisco, a few days before the 850 million dollar drawing. As people were walking out of the corner store on 23rd and Mission, I tried to buy lottery tickets off of people who I saw had just bought a Mega Millions ticket.
Here’s the audio from one notable encounter.
This guy said he wouldn’t have sold me his ticket even for $1,000!
After trying to buy tickets off a number of people, here’s a breakdown of my successful purchases. (Yes, I am indeed stupid enough to spent $15 of my own money on “research” like this.)
These few successful purchases (including the one person who generously gave me a ticket for free) come out to an average of $3.00 per ticket (pretty close to the $2.00 purchase price). But, these successful purchases were way outnumbered by the dozen or so other people I approached who weren’t willing to sell me there tickets, even after I offered to pay $10 or $20 per ticket.
What’s going on here?
For one, some people may have just been sketched out by the weird guy trying to buy secondhand lottery tickets. As weird as I am though, I don’t think that can explain everything.
Most relevant here is probably the finding that the mere act of owning something (even if you were given it randomly, just moments before) leads people to value that thing more highly. There are endless academic debates about why exactly this is. But one of the most popular theories is basically that once you own something, giving it up would feel like a loss. And because losses hurt more than equivalent sized gains feel good, people need to be compensated more highly to incur such a loss.
This is perhaps particularly amplified in the case of lottery tickets, where selling your lottery ticket, can feel like a potential loss of hundreds of millions of dollars—as very clearly demonstrated by the guy who said he wouldn’t sell me his one ticket for $1,000, because “it could be the winning ticket”. Of course, this feeling doesn’t really make sense. Anyone could have just taken my offer, bought a new ticket, and pocketed the difference. However, many people seem to have an attachment to their particular tickets. Studies on how people think about lottery gambles have found that people are unwilling to trade their own lottery ticket for another person’s ticket, even if that other person’s ticket has an equal chance of winning. And this is partly because, in some fuzzy sense they think their specific tickets are more likely to be winners.
Okay, so if we can’t trust most people to evaluate their own ticket’s value in a level headed way, where else can we look to figure out much they’re worth?
The stupid, boring, amazing math
Luckily, a bunch of math nerds ran into a similar problem when gambling in the 17th century. The basic problem, translated to our case, is this. A winning lottery ticket is worth millions. And a losing one is worth nothing. But, is there some way of thinking about the value of a lottery ticket before we know its outcome?
The answer is yes. It’s to think about a gamble’s expected value. There are a lot of ways of conceptualizing expected value, but one very concrete way is that the expected value of a gamble is the amount of money you would win, on average, if you made the bet over and over again. Amazingly, this can be calculated just by taking each possible outcome of a gamble (e.g. winning the $850 million jackpot, winning one of the lesser prizes, winning nothing), weighing each of these outcomes by their likelihood of happening, and adding all those weightings together.
This leads to an interesting tension with the lottery. The main outcome we care about—hitting the jackpot—is extremely unlikely to happen (lowering the ticket’s expected value), but pays out huge if it does happen (raising the ticket’s expected value). Which force wins out?
One way to think about which force wins out is to compare the expected value of the ticket to the $2.00 cost of the ticket. If the expected value of the ticket is less than $2.00, then on average or over time, you can expect to lose money playing the lottery—in a sense, the low odds win out. If it’s more, then on average or over time, you can expect to win money—in a sense, the large jackpot wins out .
So is the expected value of a lottery ticket more or less than its $2.00 cost?
To figure that out, for one, we need to know the odds of winning the jackpot (as well as the odds of winning the other smaller prizes, which also affect the tickets expected value).
If you’re old-school and choose to pick your numbers by bubbling them in by hand, you can actually flip over that form. And on the back it will tell you all the prize winning outcomes and their odds of happening. There’s about a 1 in a 300 million chance that you will hit the jackpot. If next president were picked by putting every American citizen’s name in a hat and pulling one out, this is about the odds that you’d be president.
The numbers printed on the form are actually approximate (and ever so slightly underestimates of your odds of winning each prize). You can do out the math yourself. I’ll spare you here. But it’s not that bad. For example, the chance of winning the jackpot is just this series of multiplications and divisions: 1/((70*69*68*67*66)/(5*4*3*2*1)*25). If you want to dive deeper, Bill Butler, an applied mathematician in Colorado, actually has a nice webpage, where he lays out all the calculations.
We can turn to the Mega Millions website to fill in the other missing piece of the puzzle—the payout for each of these winning outcomes. (Note that in addition to the jackpot, there are other smaller prizes, like matching just one white ball and one gold ball, which pays out $4.00, for example.)
Except now we run into a problem. While the values of the smaller prizes are fixed, the jackpot varies from week to week. So, maybe sometimes the jackpot is large enough for the expected value of the ticket to be more than it’s $2.00 price, but other times it’s below?
I’d like to figure this out. And to do that, I will need the jackpot size for every Mega Million drawing since October 28, 2017—which is when the current rules, odds, and prices first took effect. Where can I find this data?
Enter Dawn Nettles.
Who is Dawn Nettles?
Dawn Nettles does not like the lottery. She’s been described by the Dallas Morning News as “the state’s preeminent lottery watchdog”. She’s written exposes on the Texas Lottery’s Executive, sued the state’s lottery contractor for employing deceptive game rules, and taken the state of Texas to task for paying over $100,000 in licensing fees for obscure characters like “Scoop the Cash”.
Mostly importantly for us, Nettles runs a website called the Lotto Report, which exhaustively compiles and audits lottery data from the Powerball, Mega Millions, and a host of other Texas lottery games. This gives us the data we need.
And with a little magic in R, we can use this data to visualize how the Mega Millions jackpots have varied since October 2017.
The obvious pattern here is the spikiness of the jackpot over time. This is because of how the lottery works. There is a minimum jackpot size—which used to be $40 million, although was lowered to $20 million under Covid. This jackpot then grows and grows after each drawing without a winner, until finally someone hits the jackpot, after which the jackpot resets to the minimum for the next drawing. Across the 336 drawings considered here, the average jackpot has been worth about $170 million. And the middling jackpot size is about $125 million—meaning 50% of jackpots are above this amount, and 50% are below.
Okay, so what’s the frickin’ answer already?
It seems like we now have enough information to calculate the expected value of a Mega Millions ticket, for any given drawing. And figure out whether the expected value of a ticket is above or below $2.00.
Not so fast. We still need to take three things into account. Taxes. Time. And other people.
Taxes
First, taxes. Mega Millions winnings are taxed at the same rate as income, at the federal and state level—with some exceptions; for example, lottery winnings in California are exempt from state income taxes. Because most states do tax lottery winnings, I’ll pretend we live in New York and account for both federal and state income taxes we’d have to pay there. If we hit the jackpot, this would reduce our winnings by about 46%.
Time
Second, if you win, there are two ways to claim your money. One is in cash all at once. The other is in a series of increasingly large payments over 30 years (an annuity). If you add up all the 30 year payments for the annuity option, it is in fact this number that is always used as the advertised jackpot value. Because money now is worth more than money in the future, if you chose the cash option, you will get less than the sum total of the annuity amount. As I’ve confirmed with Professor Victor Matheson, almost everyone who’s won the jackpot has picked the cash option (although neither of us could track a source on this)—indeed, financial analyst often advise you take this option (you can always invest your cash sum and grow the sum back on your own). So, for our calculations, we’re going to assume that, if we win, we take the cash lump sum.
How much does this reduce your winnings? There isn’t an exact formula. But the key variable this depends on is interest rates—lower interest rates drive the cash option up in value (because this creates a smaller difference between money now and money in the future), higher interest rates drive the cash option down.
Okay, so how can we figure out how much your winnings are reduced by taking the cash option? Unfortunately, Dawn Nettles doesn’t have data on her website about the value of the cash option for each drawing. Fortunately, the Mega Millions website always advertises both the annuity value and (in smaller print) the cash value of the jackpot. For example, here is the banner for the $850 million drawing—which shows a $628 million cash value in smaller print below.
While this only gives us the cash and annuity value for the current drawing, we can use the Wayback Machine, which regularly crawls the entire web and archives websites, to hunt down historical lottery jackpot advertisements and compare advertised annuity jackpot values to their cash equivalents. The data is spottier here, because of the unpredictability of when Wayback Machine will snapshot the Mega Millions site. But the data we do have (from about 60 drawings) is enough to get a sense of how the cash option compares to the advertised/annuity value of the jackpot. Below, I’ve graphed the values of the annuity and cash option over time. And on the right, in light blue, I’ve plotted what percent of the advertised annuity value you would get if you take the cash. As we can see, the cash option usually hovers at around 60-70% of the value of the annuity option—it’s been as low as 55% and as high as 81%. For our purposes, I’ll use a time-weighted average, stratified by year, and say that the cash option is usually worth 67% of the advertised annuity value.
Taking the cash option and also accounting for taxes, our winnings are reduced to about 36% of the originally advertised jackpot value, on average. And we’re not even done with the reductions yet!
Other People
The final factor to take into account is other people.
As the jackpot grows in size, more and more people buy tickets. See the graph below, which shows jackpot size on the left axis and ticket sales on the right axis, over time. The two move in lock step. (The correlation is 0.81 out of maximum1 possible 1.)
This matters because nothing prevent multiple people from buying a winning ticket. While there is only one set of winning numbers, there can be multiple people with these winning numbers on their ticket. And if there are multiple winners, the total jackpot is split among these winners (this is called parimutuel betting), which reduces each person’s winning.
The more people that buy tickets, the more likely this is to happen. So, some of the gains in expected value that come from bigger jackpot sizes might be diminished by more people buying tickets and thus increasing the chance of a split pot.
How much does this diminish expected value? Again, Bill Butler lays out the math nicely on his website (which basically just involves applying the formula for a binomial distribution, a basic idea in probability.)
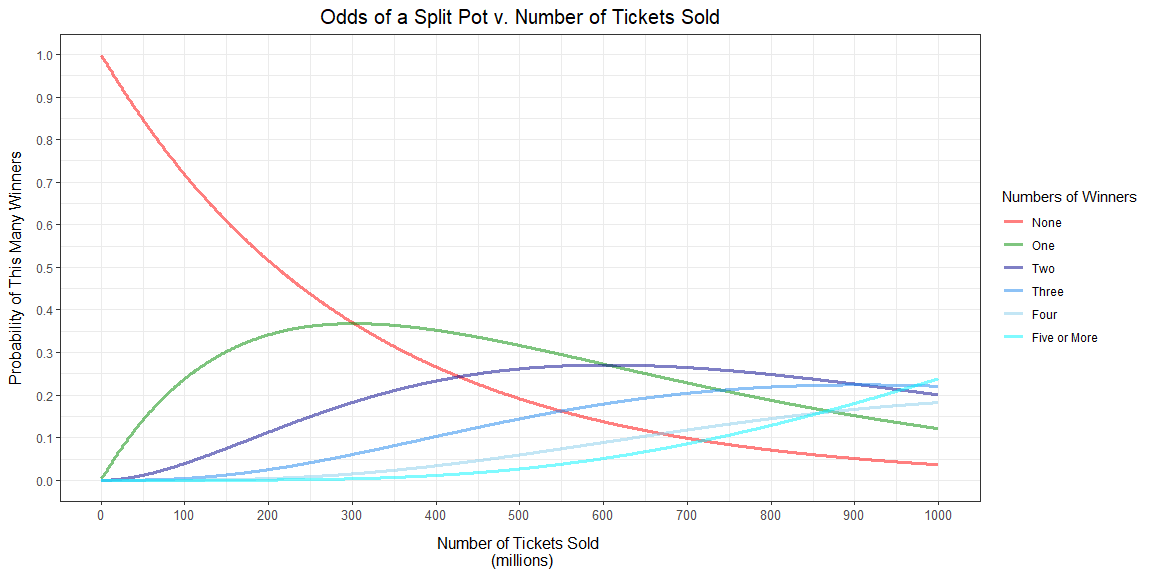
First, let’s look at how the odds that no one hits the jackpot changes for a given drawing as ticket sales increase. Unsurprisingly, as we can see, the odds that no one hits the jackpot decreases as more tickets are sold.
On the flip slide, as more tickets are sold, the odds that one (and only one) person hits the jackpot increase. At least initially. But eventually, this starts decreasing. Why?
Because as more tickets are sold, the odds increase that multiple people (two, three or even more people) will hold a winning ticket.
Okay, can we get a sense of how these probability changes relate to actual sales figures? We can. Below, I’ve taken the chart from above, but overlaid distributional information about actual ticket sales. As we can see, the vast majority of ticket sales (90%) are below 50 million tickets sold. In the average drawing, around 34 million tickets are sold. In this range, if there are any winners, it’s still most likely that there will be only one. As ticket sales rise, so do the chances of multiple winners. When ticket sales are around 200 million (which would put it in the top 99th percentile of drawings in terms of ticket sales), the odds of at least 2 winners is comfortably above 10%. For the drawing with the highest ticket sales ever (around 750 million), the odds of there being a split pot surpasses 70 percent (add up the probabilities of there being two, three, four, or five or more winners).
Finally, we have enough information to calculate the expected value of a lottery ticket.
Drum Roll …
So what happens? After accounting for taxes, the cash value of the prize, and odds of a split pot, there has never been a single Mega Million lottery with an expected value greater than the cost of a ticket. At least not in the 336 drawings since the current rules have been implemented.
Even when the jackpot was over $1.5 billion, the expected value of a ticket was well below, not just the $2.00 cost of the ticket, but $1.00. In an average drawing, the expected value of a ticket is a meager $0.43. This means if you’ve played the Mega Millions one hundred times, you can expected to lose $157 on average.
What might make the Mega Millions a winning bet?
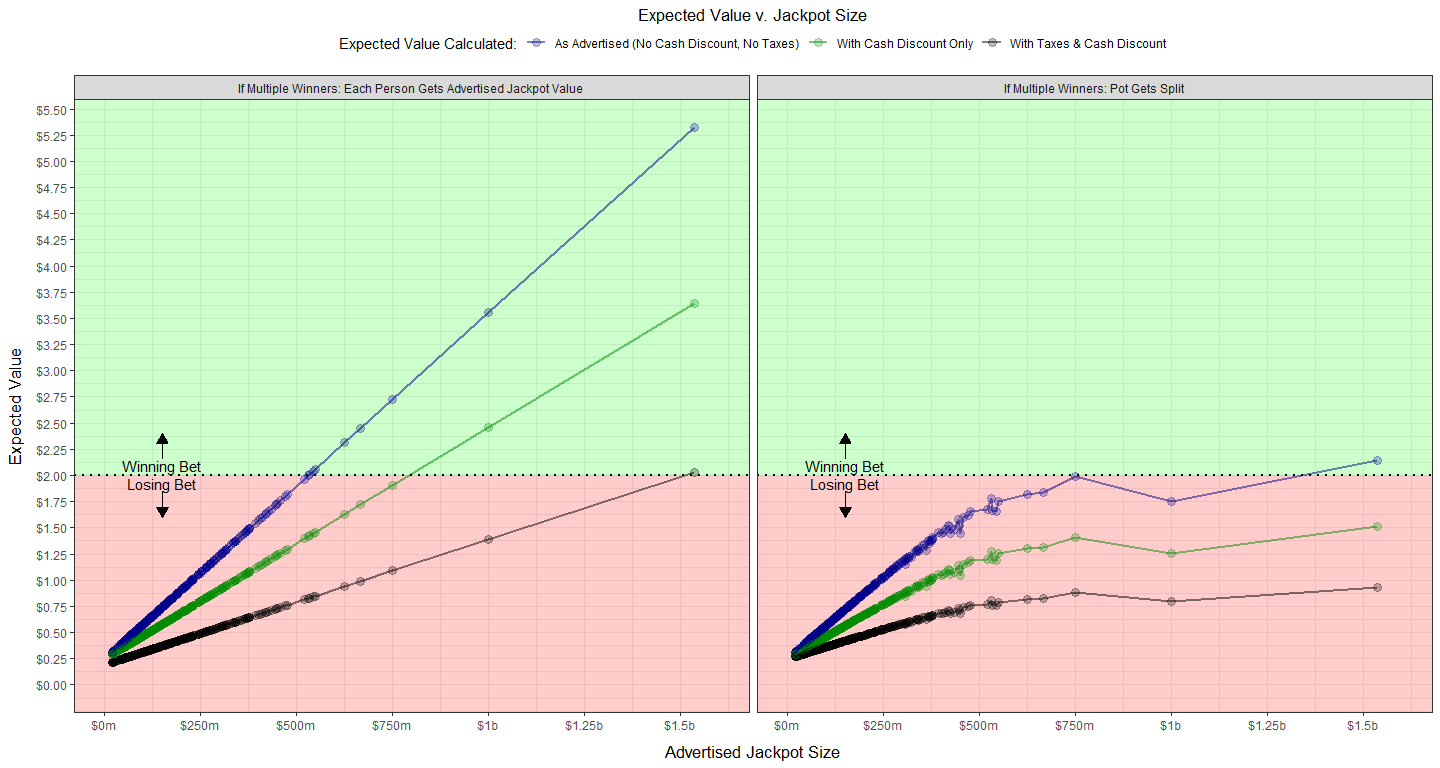
We can imagine various tweaks to reality that might make the lottery a winning proposition. For example, what if the cash value were the same as the advertised value (i.e. there was no cash discount)? Or what if there were both no cash discount and no taxes? I’ve calculated and graphed expected value for drawings in these cases below. Even across these fantasy possibilities, only once, has there been a drawing where the expected value of a ticket would have been more than its cost—in the record-breaking $1.5 billion drawing, if there were both no cash discount and no taxes. Good luck seeing a lottery without any tax collection. One other time (in the $750 million drawing), the expected value approached an even bet.
By the way, you might notice the downwards kink in the expected value of a ticket between the $750 million drawing and the $1 billion drawing. This happened because ticket sales were high enough in this drawing to offset (by increasing the chance of a split pot) the gain in expected value from the larger jackpot size.
Okay, let’s consider one final major modification then. What if there we no split pots? That is, if multiple people have a winning ticket, they each get the full jackpot sum. Even in this semi-impossible case2, we only see a few drawings where a Mega Millions ticket would have had an expected value over $2.00—all still requiring jackpot sizes in the 99th percentile, even with the other rule and tax modifications.
Back To Reality
Okay, given the current reality—cash discount, taxes, split pots—is there indeed any combination of jackpot size and tickets sales that would lead to a drawing where a ticket had an expected value above it’s cost? The highest jackpot, $1.5 billion, is only the highest jackpot so far. Maybe if somehow the jackpot got even bigger while sales somehow got a bit lower, we might have a winning bet?
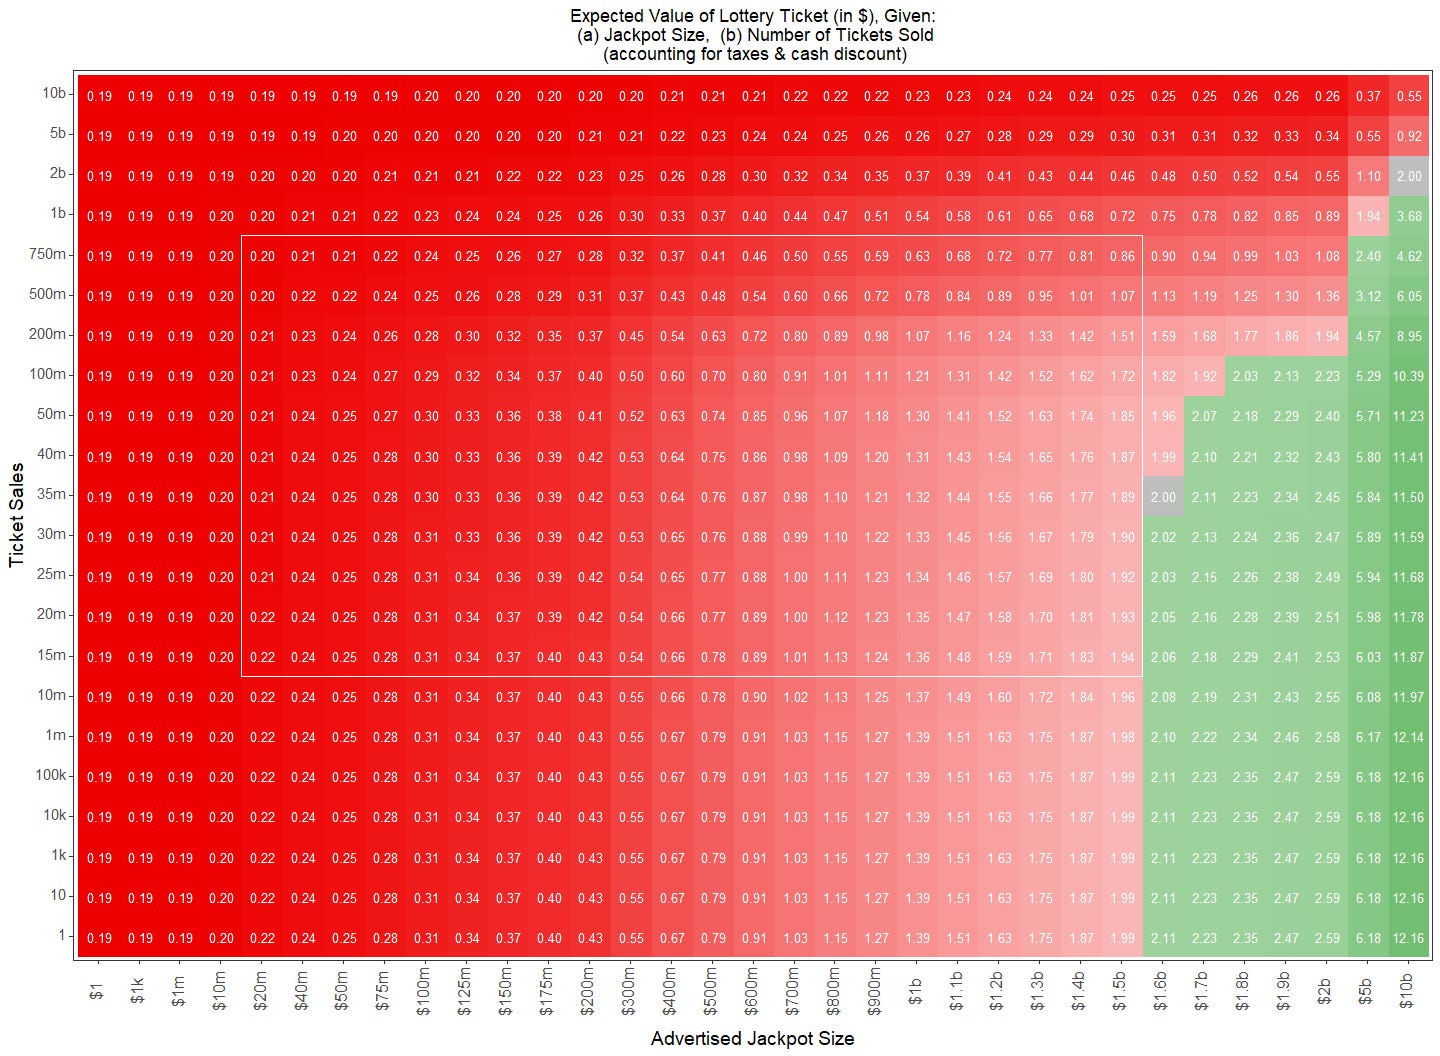
To analyze this, we can use the following chart (which is an elaboration of a table by Bill Butler, to whom I owe a lot of my thinking here). On the x-axis are jackpot sizes, and on the y-axis are total ticket sales. And at every point where they meet—for example say a $1 billion dollar jackpot, with 30 million ticket sales—I fill in the expected value of a ticket from that drawing ($1.33, for the combination just mentioned; see the crosshairs). Boxes are colored red if the expected value of a ticket in a drawing is lower than the $2.00 ticket price, and green if above.
A sea of red.
And the few jackpot and ticket sale combinations that lead to an expected value more than the $2.00 ticket price (green) will essentially never happen. To help display why, I’ve added a white box to the figure. This white box is bounded on the left and right by smallest and largest jackpot sizes, respectively, ever observed ($20 million and $1.5 billion), and bounded on the top and bottom by the highest and lowest sales, ever observed, respectively (750 and 15 million tickets). The only drawings that would lead tickets to have an expected value higher than the ticket price would need record-breaking jackpot sizes ($1.6 billion or more) combined with unrealistically low ticket sales for jackpots of that size.
Does This Mean It’s Dumb To Buy A Lottery Ticket?
Actually, not necessarily.
All the analysis above might have seemed quite bleak. But it might still be perfectly reasonable for you to buy a lottery ticket.
The problem with only thinking about expected value
In the analysis above, we have relied solely on expected value to judge bets. If the cost of a bet is more than its expected value, it’s bad. Otherwise, it’s good. The Mega Million lottery is a bad bet since it costs $2.00, but its average expected value is 43 cents.
But this type of reasoning—only focusing on expected value—can lead to some funky places. For example, consider a different scenario. I toss a coin that has a 50% chance of landing on heads and 50% chance of landing on tails. If it lands on heads, I give you $50,000. If it lands on tails, you lose $50,000. This bet has an expected value of exactly $0.00. Is there really no difference between taking this bet and actually receiving zero dollars?
Or what if I made the bet slightly sweeter. Same odds, and you still lose $50,000 if it lands on tails, but if it lands on heads, I give you $50,002. Now the bet has a positive expected value. Specifically: $1.00 (i.e. $50,002 * 0.5 - $50,000 * 0.5 = $25,001 - $25,000). Would you be dumb to turn this bet down if I offered it to you for no cost or say 1 cent? It seems perfectly reasonable to have no appetite for this bet.
Something is missing if we only think about bets in terms of expected value.
The thing that is missing is the fact that we care about what money brings us, not money itself. A hundred dollars or a hundred million dollars is good because it’s let’s us buy and do stuff we want—eat food, go on vacation, and spend less of our time cleaning our house.
In our lives, we are not trying to maximize money itself. But what money can bring us—freedom, prestige, comfort, joy, ease, and a million other things. Let’s call all that stuff happiness.
To think more clearly about bets, we need some sort of theory about how money translates to happiness.
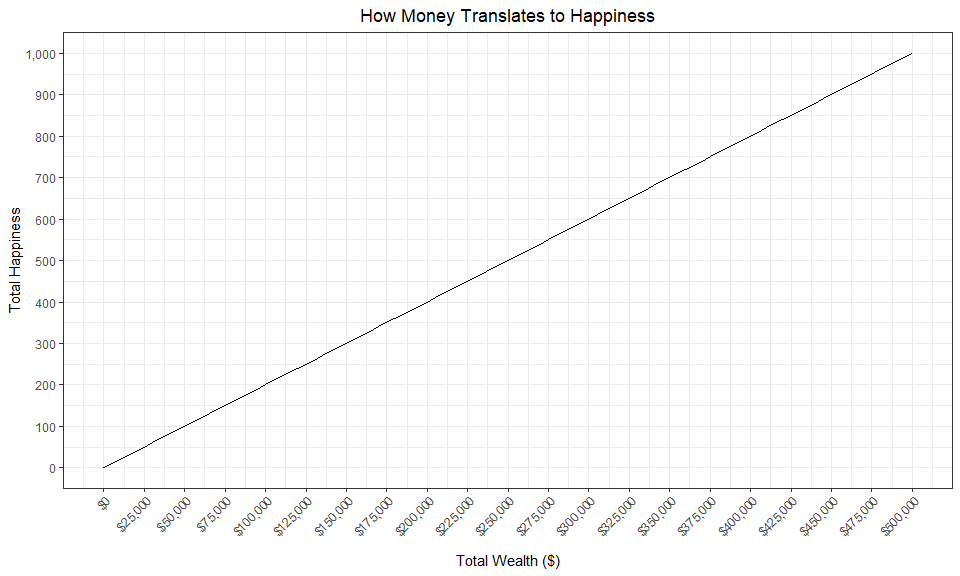
A very simple theory might look like this. There is a straight line relationship. More money brings more happiness. And always at the same rate.
That “always at the same rate” part might seem trivial. But it’s actually an assumption that has a very important implication. It means that loses of money decrease happiness by the same amount that equal sized increases in money increase happiness. For example, losing $50,000 decreases happiness by the same amount (100 “happiness points”) that gaining $50,000 increases happiness (100 “happiness points).
But maybe this isn’t how things really work. Maybe a more realistic theory is that more money brings more happiness, but at a slower and slower rate. Think about going from making $50,000 a year to to $500,000—your entire life would change, you can start thinking about buying a house, moving to a new neighborhood, hiring a full-time nanny. But how much more would your life change and get better if you went up from another $450,000 from $500,000 to $950,000? Probably not as much. Your third Porsche is great, but probably not as great as your first one. So maybe the money-to-happiness curve looks more like this.
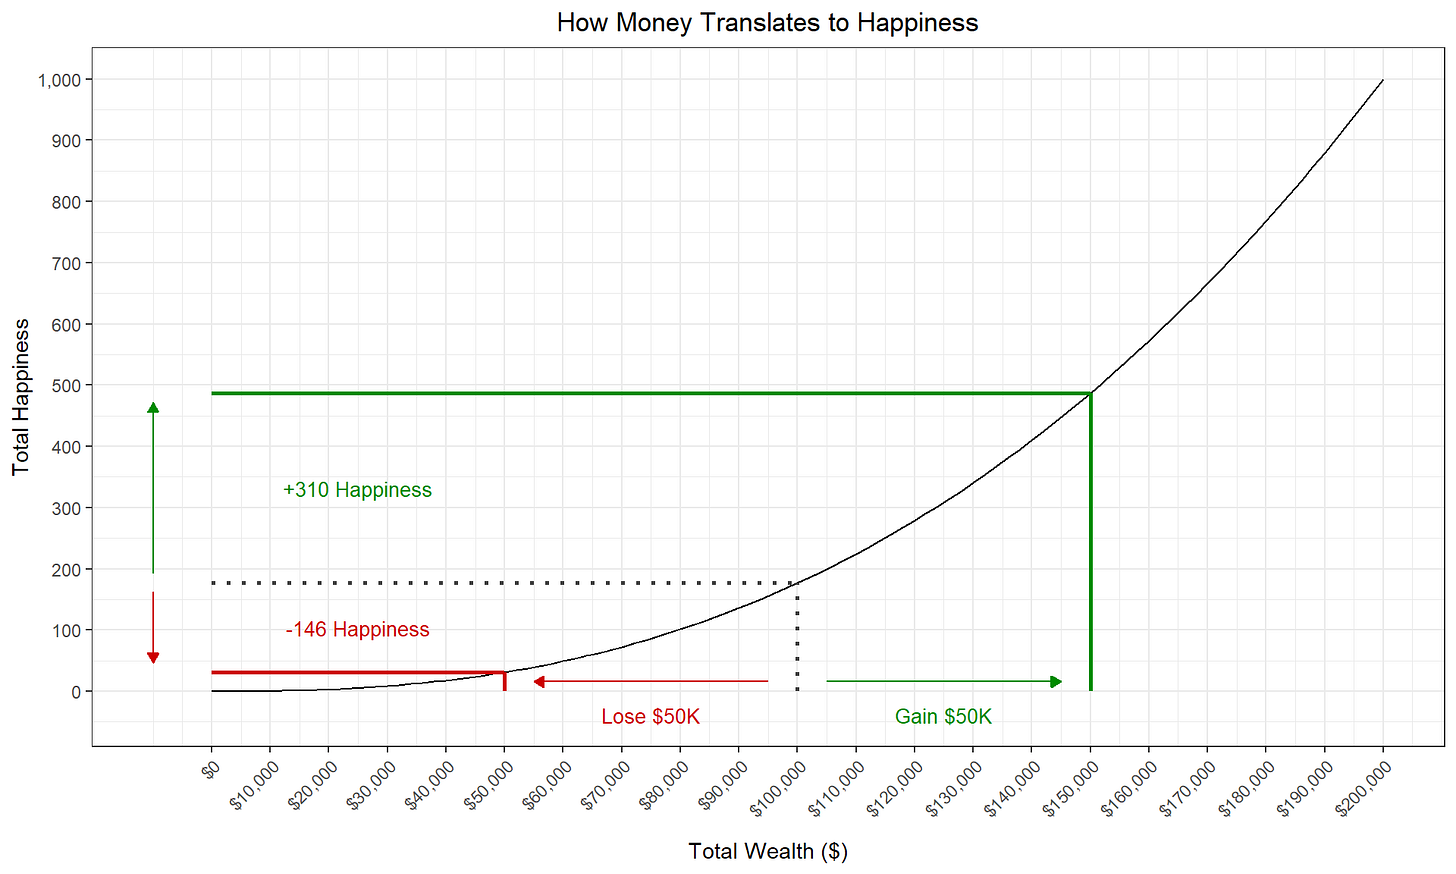
This diminishing returns of money on happiness has an important implication. It means that loses of some amount of money will lead to larger decreases in happiness than equal sized gain in money will increase happiness. And this can explain why you would be perfectly reasonable to turn down that $50,000 bet from before. Here, losing $50,000 would decrease your happiness by more than twice the amount that winning $50,000 would increase your happiness. While expected value (in dollars) is 0.00, expected value (in happiness) is negative (-310 * 0.5 + 146 * 0.5 = -82). For the bet to be worth it in happiness, either the odds of winning would need to be higher (and the odds of losing lower) or the amount of money you win would need to be higher (or the amount you lose, lower).
This money-to-happiness curve might seem silly. But this diminishing returns on happiness for each additional dollar is actually the standard explanation for why people are “risk averse”. If that relationship holds for you, then in dollar amounts, you need potential loses to be more than offset by potential gains, to take a gamble.
But this type of money-happiness profile would only make a lottery ticket even more unattractive. The potential gains in money would be further shrunken down, relative to the losses, making the gamble even more unattractive, when translated to happiness, than it already is in dollars.
So is there any type of person the lottery might appeal to?
Yes—people who are “risk-seeking”. Risk-seeking means having a money-to-happiness relationship that looks like this. Not only does each additional dollar increase happiness, but each additional dollar brings more happiness than the last. The rate at which money increases happiness is itself increasing.
When might this be realistic? Consider this scenario. Your life long dream is to leave your home state of Iowa and travel to Los Angeles to become a movie star. The cheapest way to get there is to drive. But someone stole all four of your car’s tires. Each tire costs $100 to replace. If you got $100, $200, or $300, your happiness would increase. You would have more money for groceries for example. But you could only buy 1, 2, or 3 replacement tires, respectively. But with $400, you could replace all four tires and drive to Los Angeles and live out your lifelong dreams. The fourth set of $100 would increase your happiness way more than the previous three.
While this scenario might seem a little far-fetched, more generally it describes any situation where getting to a certain level of wealth makes your happiness jump up more than simply approaching that level. And for many people, winning the lottery might be like this. While a raise from $50,000 to $75,000 might make life better, $100 million would change your life—you could quit your job, buy a boat, and travel the world.
In contrast to someone who is risk-averse, for someone who is risk-seeking, a gain of a certain amount of money would increase happiness more than an equal sized loss of money would decrease happiness.
People with this risk profile might be willing to take bets that have a negative expected value in dollars—because they may still have a positive expected value in happiness.
So are all lottery players risk-seekers?
But wait, something seems inconsistent. Many times, we refuse gambles which have a positive expected value (like a 50-50 shot at winning $50,002 or losing $50,000), suggesting that we are risk averse. Yet other times, we accept gambles with a negative expected value (like the lottery), suggesting we are risk-seeking. So what’s going on?
Honestly, we don’t really know. This is still an active area of research in economics and psychology.
One of the earliest and simpler attempts to reconcile this behavior goes like this. It basically says that we are both risk-averse and risk-seeking, in different ranges of wealth. The researchers to propose this were Milton Friedman and Leonard Savage. And this squiggly curve they drew mapping money to happiness describes the crux of their theory. You can almost think about their squiggly line as describing how your happiness would change as you move between social classes (which we’ll assume to be larger determined by wealth). For any monetary gain that keeps you within your social class (say moving from $50,000 to $85,000), you might having diminishing marginal utility of money, and thus be risk-averse. But for any gain that let’s you break out of your social class, (say jumping from $85,000 to $120,000 or above), you might become risk-seeking. And then once you’re in this class, you again become risk-averse, because monetary gains just make your life a little better within your class. But as you get a chance to break out and up into the next social class (say $1 million a year), you might become risk-seeking again.
It’s possible that something like this explains why people choose to play the lottery. But immediately there are problems. As Professor Jonathan Gruber points out in his wonderfully clear introduction to the economics of uncertainty, this leaves other gambling behavior unexplained. For example, consider not the Mega Millions, but the scratch off games, where you win maybe $100 or a few thousand. Since the sums here are very tiny and would not allow you to win enough to break out of your social class, people should be risk-averse and not take this bet, if Friedman and Savage are right. Yet, these are some of the most popular lottery games.
We could continue on and on trying to explain all of these idiosyncrasies. I’ll stop here. But people have won Nobel Prizes making advances in our theories of how people think about gambles and lotteries. So give it a shot, if you have any new ideas.
Final Verdict
Okay, so where does that leave us? It might make sense to play the lottery. It might not. People might be risk-averse. They might not.
At the end of the day, you can expect to lose money playing the lottery. And more worryingly, as Alvin Chang points out, the people most likely to lose this money are poor people and members of marginalized groups.
You can see this by looking at where lottery winners come from. They are more likely to come from poorer neighborhood and neighborhoods where a higher percentage of residents are racial minorities. This isn’t because those groups are luckier, everyone is equally likely to win, it’s just because they are playing more.
The vast majority of this money also isn’t spent on the big games—like Mega Millions—but small scratch offs. From what I’ve seen, these games seem especially pointless, slot machine-ee, and likely to exploit addiction. When I was in the Mission buying tickets, I met one guy who was in the store easily for an hour, buying scratch offs, losing, throwing them in the garbage, and going back and buying more. Another person alternated between playing scratchers and panhandling.
Even more shocking are the results from a survey by the Consumer Federation of America. This survey found that about a fifth of Americans “think that winning the lottery represents the most practical way for them to accumulate several hundred thousand dollars”. Yikes. And the portion saying this increases to over a third, for people whose incomes are below $25,000.
This seems bad. Both because lotteries are not a good financial instrument—you should expect to lose money playing them in the long run. And because it suggests that people don’t have much hope for better alternatives to accumulating wealth than playing losing games of chance.
So, my final verdict is that there are ways to intellectually justify playing the lottery. But it’s very obviously a losing bet in dollars. If you’re spending any serious amount of money on the lottery, you might want to reconsider.
Code & Data
I did all the analysis and visualization for this post using R. Here is an readable html-knit Rmarkdown, hosted on my website, that goes through my analysis step by step. And here is a link to the github repository that has the original Rmarkdown file and some other supporting files.
yesss, if you want to be a stickler, the range of a correlation is -1 to 1. and i should be talking about the absolute value of the correlation if i want to just make the range 0 to 1. but just trying to keep language simple here
this isn’t even really possible. theoretically the way a lottery works is everyone buys tickets and then the jackpot is just the total amount of money spent on those shares. (a little more complicated with the mega millions this pool also rolls over from drawing to drawing if there isn’t a winner, and you also have to subtract out the smaller prizes. but otherwise the basic idea is the same. the jackpot size is the sum of ticket sales.) so, if you were to award the full jackpot size to multiple winners, you would have to come up with money that is not even there. but we can still imagine such a case. maybe the government subsidizes the lottery jackpot with funds that would have otherwise been used to build aircraft carriers.











It's so hard to win with such odds in Romania... https://vreauloto.ro/sanse-castig
An other incredibly well done article by you .
Easy reading ,facts based ,captivating .
Excellently written ,great graphics explanations ,witty yet seriously explains everything to the core of how the system works .
Enjoyed reading it and my understanding of how this works got a whole new meaning .
Thank you for your hard work to explain to all of us the "mechanism " of "gambling".